Evolution of stravawindanalysis.com
![]()
Table of contents
Motivation and Introduction
During high-school I was wondering if there was some way to determine how much wind affects road cyclists’ speeds.
Strava is a popular cycling platform, where riders “record” their rides and share with others. This is accomplished by using GPS that periodically captures longitutde/latitude and timestamps it in GPX format - so at any given moment Strava can recollect your position and calculate your speed. Segments are defined roughly as a string following a polyline starting from one coordinate and ending at another coordinate with a predefined shape. Over time, many people upload their rides and we can get a leaderboard of different people’s attempts at segments over time.
The critical issue with this segment functionality is that conditions aren’t always equal - if you have a 50km/h tailwind you will go have to displace less wattage to reach that winning speed - but how much does it really help you? Introducing Strava Wind Analysis!
Extensive Redesign
The most apparent issue with the initial design is the absence of a backend which severely limits the capabilities of the web app since everything resides client-sided. The newer design features a cloud-hosted architecture stored on Amazon Web Services, opening a world of possibilities.
Features
The newer version of the website expands beyond simply weather analytics to providing both historical and segment ride analytics. There are feature additions throughout, including:
- Improved regression models for cycling wind impact determination
- Content-based segment recommendation engine for scrolling feed
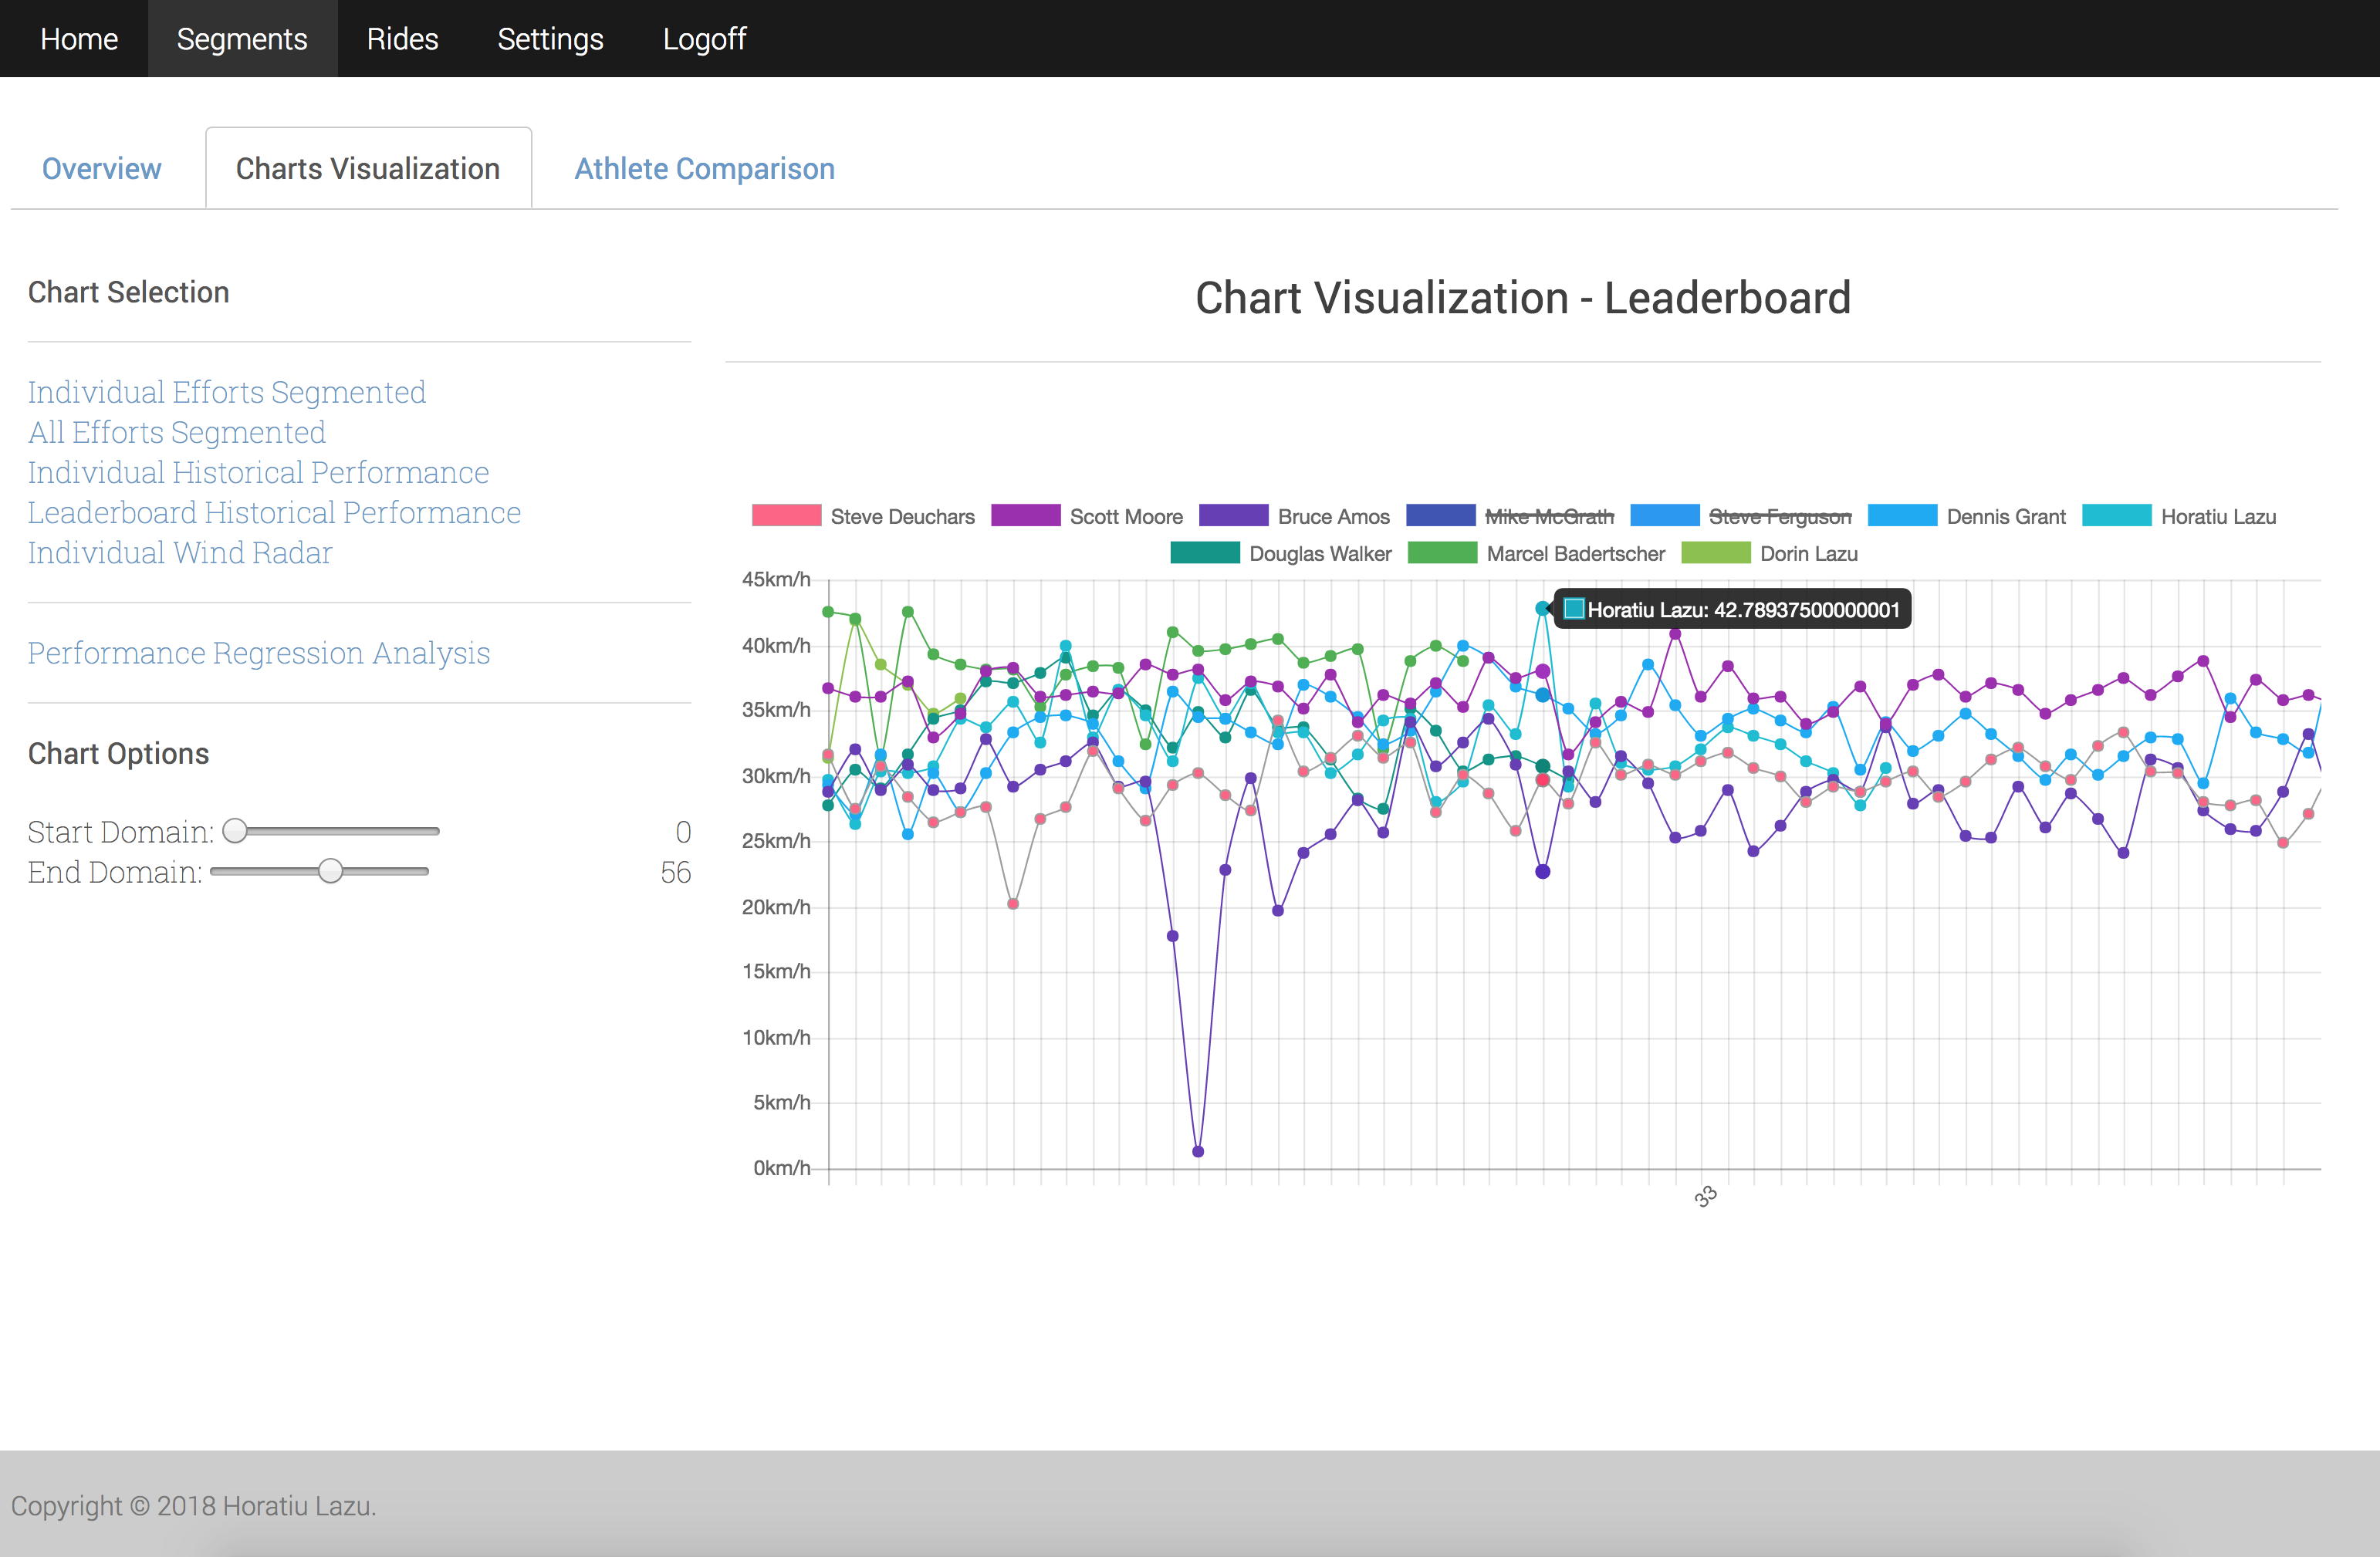
- Interactive charts using chart.js
- Performance analytics on historical segment and aggregate data
- Individual modals with athlete-specific statistics on segment leaderboard
- Linear regression and interpolation tools using scikit-learn
- Segment and ride filtering options (distance, speed, etc.)
- Improved performance with Redis caching
- Integration with MongoDB including weather API throttling and user profiles
After users login, they are presented with the feed page. Powered by a content-based recommender system, this feed aims at featuring segments that are recent and may be of interest.
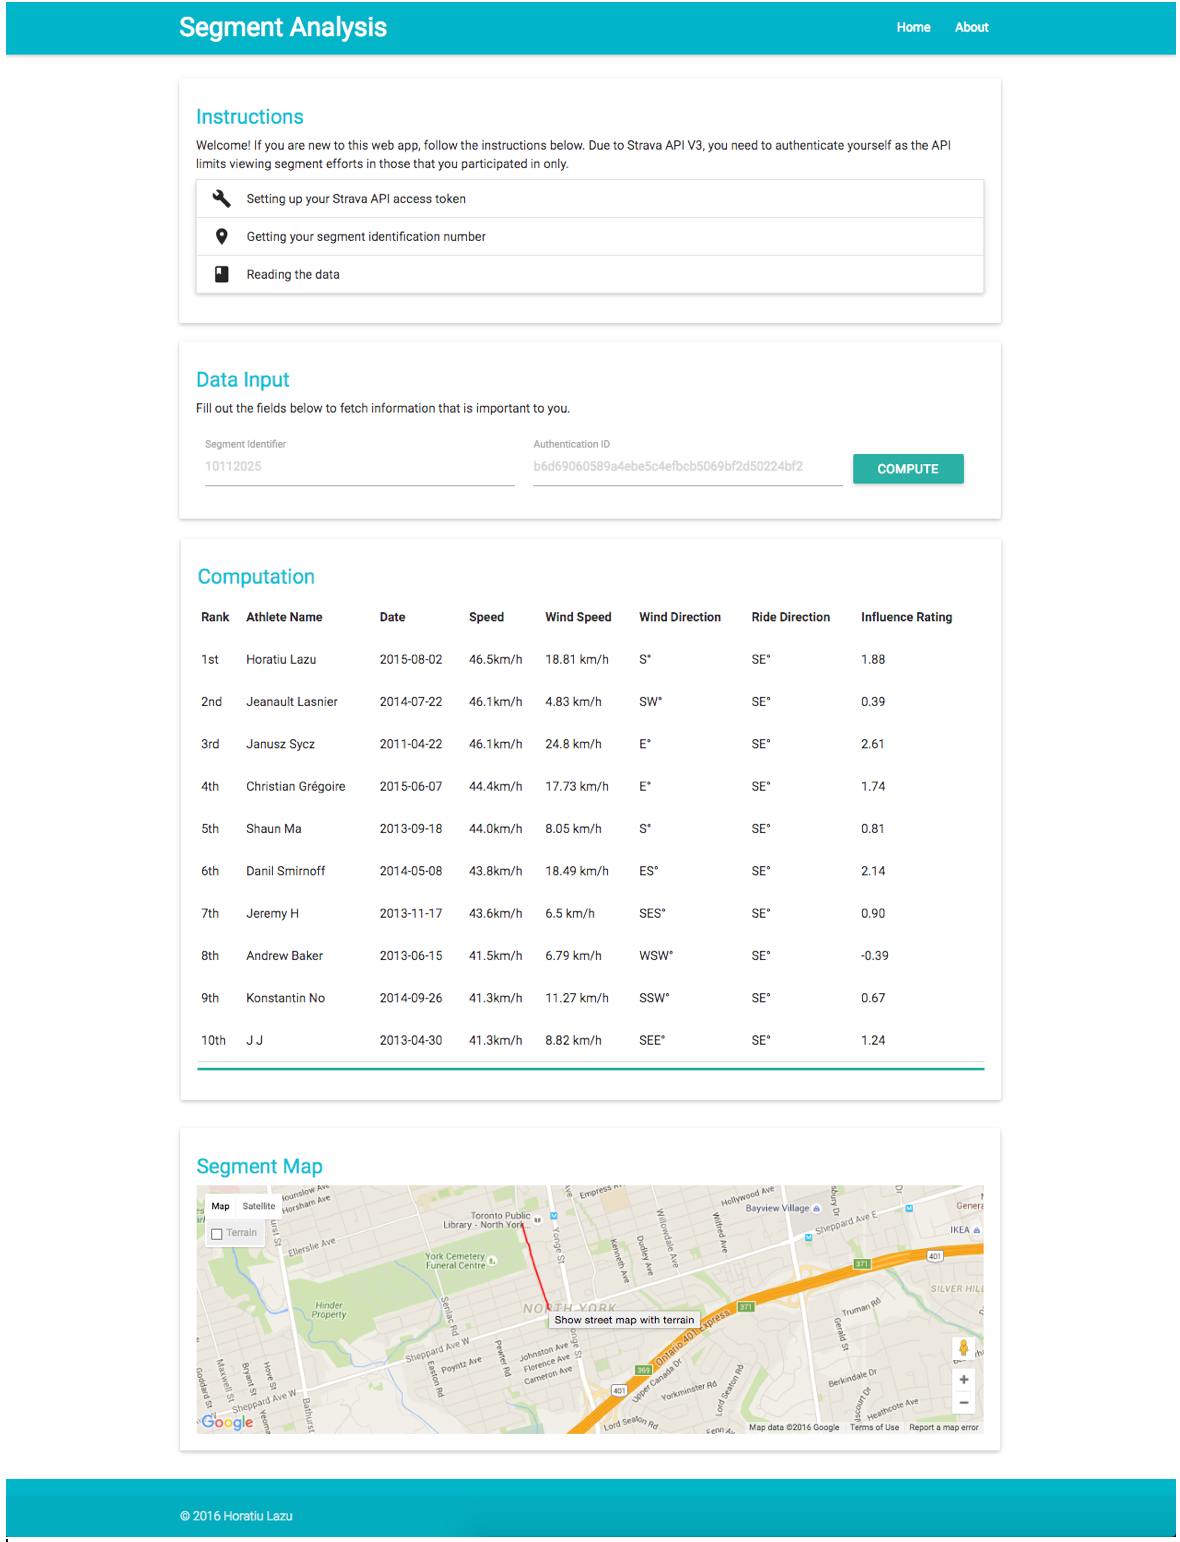
The new details page is redesigned, with tabs for different content for that segment.
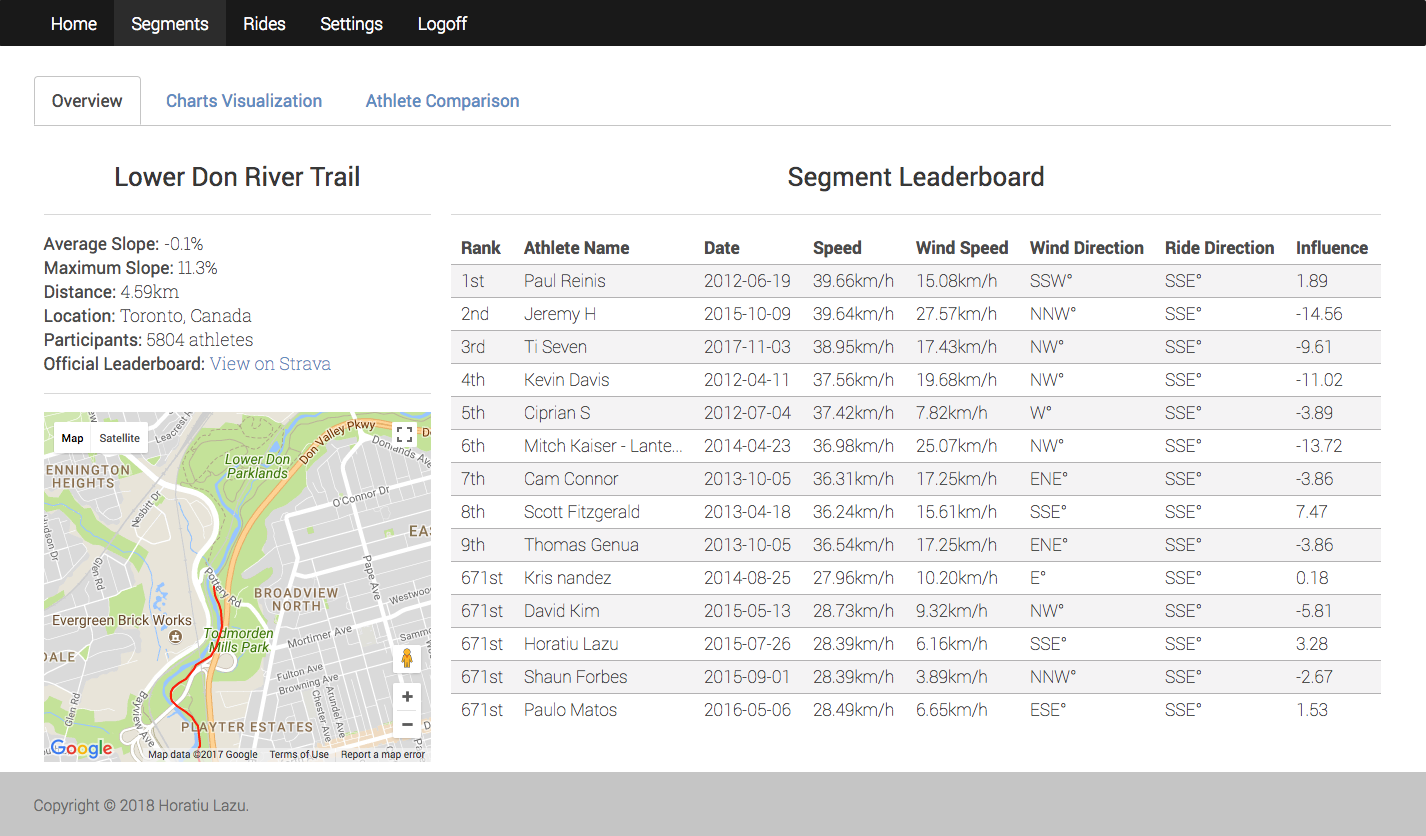
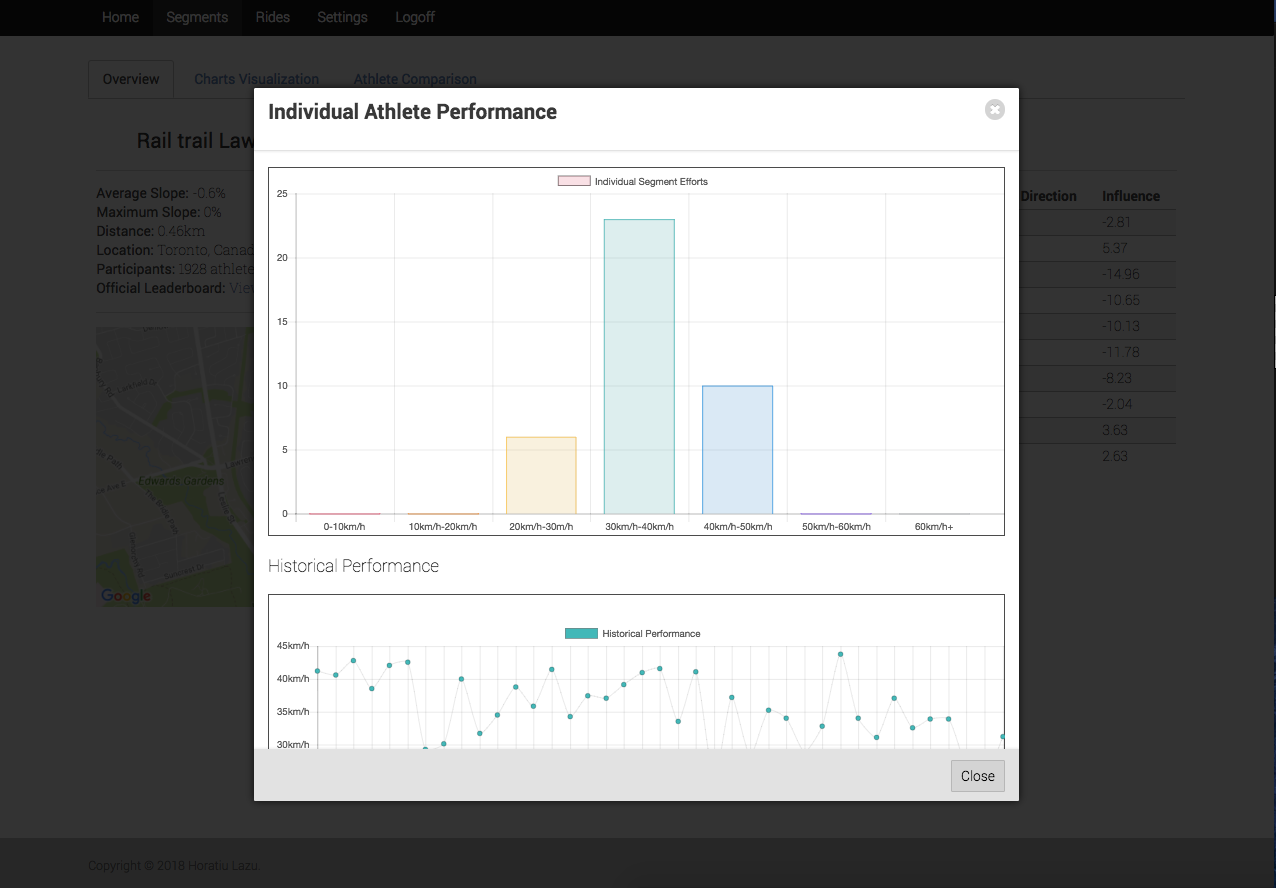
There are modals now for individual athletes showing historical performance aggregate performance on segments. Similarily, there are modals on the ride selection screen showing a map of the ride.
The charting system allows the ability to do speed overlay for different athletes on a single chart.
Architectural overview
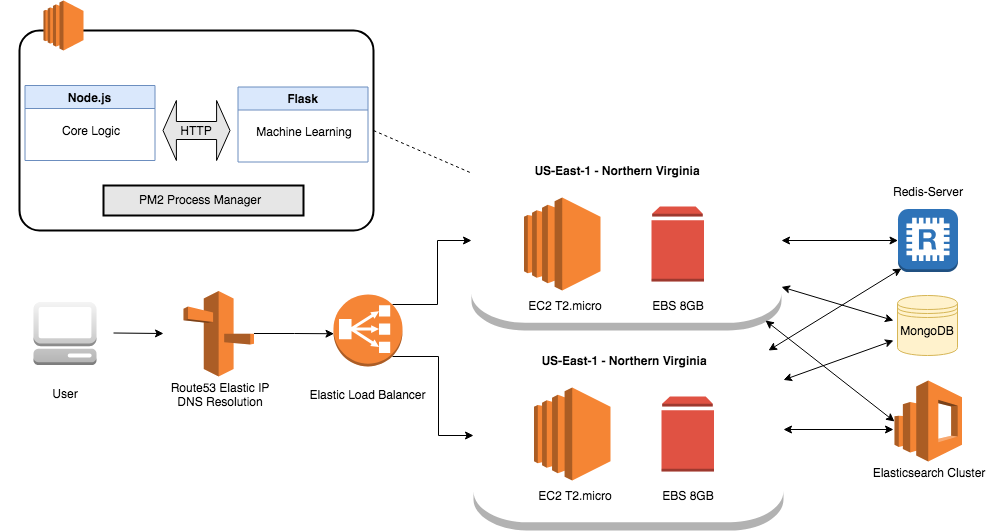
The newer architecture runs on Amazon Web Services using EC2 instances and Route53 for Elastic IPs. The infrastructure is managed using Terraform, which allows for reproducability and high scalability.
The core site is a monolithic repository written in Node.js leveraging Express to power the webserver layer, along with Handlebars as the templating engine for rendering the site headers and footers. The front-end leverages jQuery and Ink Framework. There is a seperate Python Flask service handling the machine learning components, which uses NumPy and Scikit-Learn for any statistical analysis and is communicated using a RESTful interface by the Node app. Both the Node and Python server are managed by PM2, which allows for thread forking and zero downtime restarts.
Redis is used as an in-memory cache for API look-ups (30 minutes TTL), and provides lifetime caching for weather data requests from DarkSky. Elasticsearch provides an index for segment and rides by rides, which periodically indexes upon login based on a previously set epoch-update time. Lastly, MongoDB is used for user profiles including throttling for abusive users.
Models and Algorithms
Wind Impact Determination Algorithm
The core intent of the Strava Wind Analysis site is to numerically quantify the impact of wind conditions on a cycling segment. Since this isn’t a solved problem and there is no method to verify the validity of the results, over time the algorithm evolved to take into consideration more factors which increases the likelyhood of accuracy.
The original algorithm used basic theory from relative physics, that is, we take two vectors representing the wind direction and ride direction, add then tip-to-tail, and then take the displacement vector which would be the resultant vector. The impact would be the delta between the original ride vector and the displacement.
The beginning set of improvements over the legacy vector-manipulation approach concerns drawing conclusions from the results of an empirical study on how wind affects cyclists. The following results are taken from Jobst Brandt’s A Practical Analysis of Aerodynamic Drag.
The first observation is that the previous vector-based model falls victim to assuming that tailwind and headwind will equivalently affect riders which is incorrect.
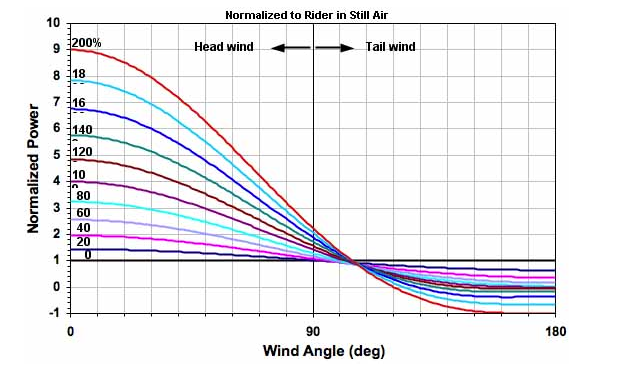
The second observation is to provide a mapping for how much a difference in speed makes for the wind impact. This is of course very difficult, but can be best modelled using a function. What is this function?
$f(x) = -0.004x^2 + 0.616x + 0.863$
How was this equation generated? Using quadratic regression on empirical riding data in a wind tunnel (assuming that the head-wind is direct), and with a constant wattage it’s possible to interpolate values.
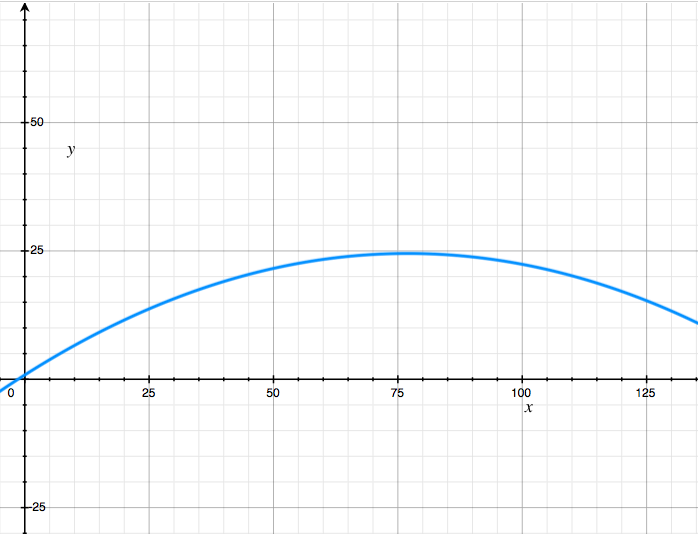
Thus, $x$ is the wind-speed in direct head-wind, and $y$ would be the net change in wind-speed. Since wind isn’t always directed parallel to the cyclist, the former vector manipulation algorithm is executed but both units are turned into unit vectors, and then the displacement vector’s magnitude is multiplied by the value of this function yielding the final result.
This works fairly well in practice, however there is more to consider. There is a plethora of data containing historical wind performance and the speed at which the cyclist rode. Ignoring factors (amount of effort or energy the rider places), it’s possible to use non-anomalous efforts as training data for a statistical model.
Former segment efforts can be used as training data. Consider a function $H(x, y, z)$ where $x$ is the effort distance, $y$ is the effort slope, and $z$ is the direction-adjusted wind speed (see the former vector approach), and returns the expected segment effort speed. Clearly, every segment effort has values for $x$, $y$ and $z$ hence this becomes a classic application of regression and/or neural networks. At the end, calling the same function with $z=0$ will predict the speed without the influence of wind - hence $H(x, y, z) - H(x, y, 0)$ is the impact!
First attempt used multivariate linear regression with several features including effort distance, moving time, ride bearing, average speed for the whole ride, wind speed and wind bearing. After normalizing the values with a standard scalar, applying the vector manipulation approach, and using a 70%/15%/15% training/cross-validation/test split, below are some sample results:
sample predicted vs actual
---
25.26km/h vs 29.28km/h
26.02km/h vs 28.65km/h
26.57km/h vs 28.04km/h
22.04km/h vs 22.6km/h
22.11km/h vs 21.74km/h
18.63km/h vs 19.85km/h
27.04km/h vs 29.26km/h
21.28km/h vs 23.02km/h
26.2km/h vs 27.28km/h
20.6km/h vs 22.46km/h
26.34km/h vs 29.62km/h
26.01km/h vs 27.42km/h
29.27km/h vs 29.55km/h
27.41km/h vs 29.61km/h
---
Root Mean Squared Error: 6.1968908459
Coefficients:  [-0.31109429 -0.49802149 -3.11181539]
Intercept:  25.9555685519
While the results are accurate on the most part, some results greatly increase the RMSE:
$RMSE(y)=\frac{1}{N}\sqrt{\sum_i{(f(x_i) - y_i)^2}}$
During actual segment efforts, this model is significant off inflating the expected result since most efforts during KOM attempts are anomalous themselves! Hence, this model will be wrong, but that is OK since only $z$ is changing.
The other approach is using neural networks. Using a multilayered perceptron neural network, a similar process was used as the multivariate linear regression model in terms of features and approach. While it certainly sounds fancy, using the Scikit-Learn library it makes it relatively straightforward to apply.
The final results after doing some hyperparameter tuning (using the Stochastic Gradient Descent model):
sample predicted vs actual
---
24.75km/h vs 22.36km/h
25.5km/h vs 32.15km/h
25.29km/h vs 18.81km/h
24.6km/h vs 28.44km/h
25.12km/h vs 29.28km/h
25.99km/h vs 28.65km/h
26.61km/h vs 28.04km/h
21.36km/h vs 22.6km/h
21.43km/h vs 21.74km/h
17.36km/h vs 19.85km/h
27.18km/h vs 29.26km/h
20.47km/h vs 23.02km/h
26.2km/h vs 27.28km/h
19.66km/h vs 22.46km/h
26.36km/h vs 29.62km/h
25.99km/h vs 27.42km/h
29.75km/h vs 29.55km/h
27.6km/h vs 29.61km/h
Root Mean Squared Error: 5.60815702584
While the root mean squared error is lower, this model performs better with the anomalous cases but poorer on median. With both models into consideration, the multivariate linear regression model remains the top choice as the core system for computing wind impact.
Infinite Scrolling Segment Feed Recommendation Algorithm
The motivator of the content-based feed from a product perspective is to provide:
- Very fast way of showing relevant segments to the user (instead of searching for them)
- Allow the user to discover potentially unique or anomalous segments
- Provide an incentive for returning to the site by outlining fresh new content
The most stressed factor is new content, hence the recommender system heavily boosts more recent rides. As such, below are some factors taken into consideration when ranking segments:
- How recent was the ride that the segment took place on?
- Has there been a KOM/QOM achieved?
- Is there a new Personal Best or Top 10 rank achieved?
Another criteria for this recommender system is that it must be quick to retrieve results - since this is the first thing the user lands on once logging in. The rough algorithm looks as follows:
- Lazily fetch ride data from Strava API in sets of 3 rides
- Redis will cache the newer than
index-epochrides faster than Elasticsearch indices
- Redis will cache the newer than
- Iterate through all segments from those rides and rank candidates
- This will use the points system below
- If there are less than
16segments retrieved, lazily load more until failure
How are segments ranked? This is computed as follows:
| Factor | Formula | Factor Type |
|---|---|---|
| Ride Recency | 10x, 5x or 1x |
Multiplier |
| KOM/QOM Achievement | 20 |
Addition |
| Leaderboard Ranking | 20 - rank |
Addition |
| Personal Best | 5 - rank |
Addition |
This systematic scoring system provides a heuristic for rankings segments. In recommender system theory, this qualifies as a content-based recommender system since we rank content based solely on discrete characteristics.
YouTube Demo
Original Design
For my first web-app ever, I created a single page web-app in high-school using client sided jQuery and JavaScript along with a simple vector manipulation algorithm. This design features both critical design flaws and is extremely limiting in terms of capabilities.
Architectural Overview
As mention prior, everything is stored client-sided, so there is no session data persisted. The website design is created using Materialize CSS and jQuery. The core logic is written in JavaScript, which can actually be found at src/js. The site interacts with the Strava API using OAuth, Google Maps API and Dark Sky API to fetch the weather data. The site can be found at stravawindanalysis.com/legacy, with the exception of API keys which were stubbed with API calls to the newer backend.
The simple algorithm worked by fetching the wind data, the ride direction, normalizing the vectors, scaling the vectors by their respective speeds, and then checking the displacement when added tip-to-tail.
Original Design YouTube Demo
Future Plans
Global Neural Networks
Extending from the idea of the current models, adding the ability to expand the training set to use information from other riders can allow for significantly more advanced capabilities. Additional features will be created dependent on the rider, for example the rider’s average speed, riding patterns, and then every user’s behavior can be contributed to a global state neural network.
Of course, users can subscribe/unsubscribe from donating their personal data - but these capabilites will allow for pooling more data and attempting to create a more accurate model for estimating speed given the ride environment and player type.